
Morning Star: A Long Down Candle, a Small Middle, and a Long Up Candle
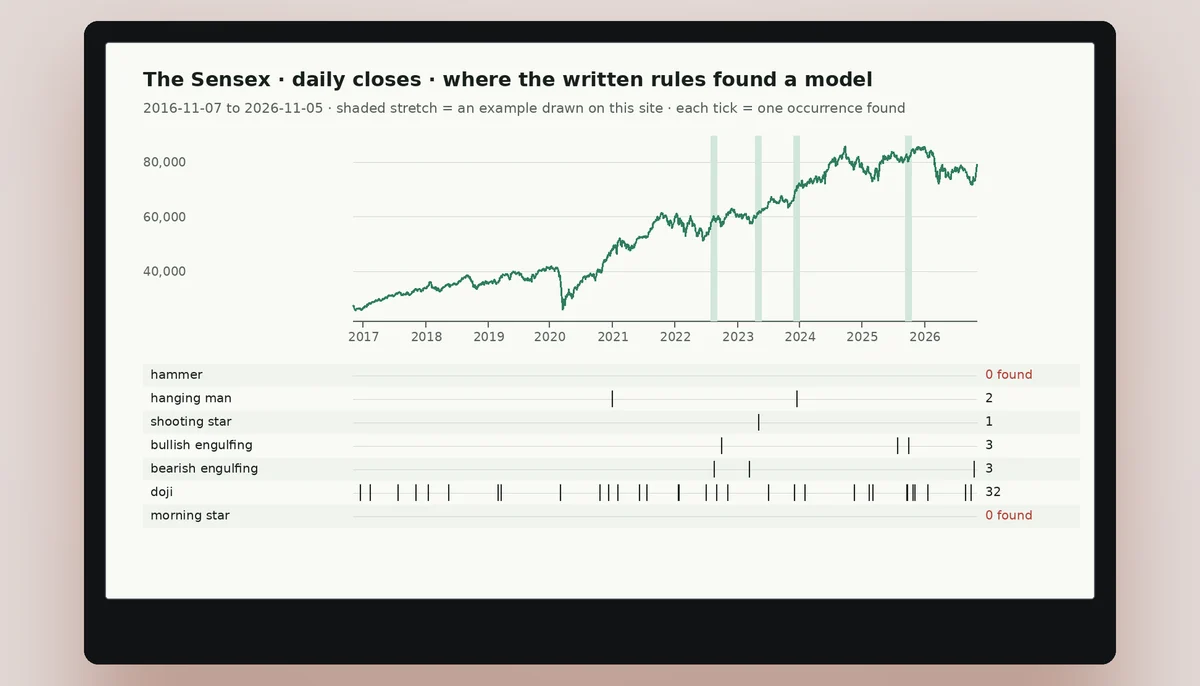
A morning star is a three-candle pattern: a long down candle, a small candle that stands apart from it, and a long up candle that closes well into the body of the first. It appears after a fall. This page has no chart, and that is the finding: in ten years of daily candles on the Sensex and Nifty Bank, the written rule for the morning star found none.
The exact definition
A morning star, as rule MS-1 defines it, takes three candles. The first is a down candle with a body of at least 1 ATR (the average true range of the last 14 sessions). The second is a small candle whose body is at most 35 percent of the first body and lies at or below the first close. The third is an up candle with a body of at least 1 ATR that closes above the middle of the first body. The three must come after a fall: the close of the session before them stands at least 2 ATR below the highest close of the 5 sessions ending there. The pattern counts as formed when the third candle closes.
Each condition is a number, so each can be checked against a daily chart. A middle candle that is not small is not a morning star; a third candle that does not reach past the middle of the first body is not one either. Nothing is rounded in the pattern's favour.
What each of the three candles says
The first candle, long and down, shows that sellers are in control and the fall is strong. The second candle, small, shows that the selling is losing momentum. It may be a doji or a small-bodied candle, and it often gaps below the first, showing a last push down that goes nowhere. The third candle, long and up, shows that buyers have taken control and pushed price back up, closing well into the first candle's body. The three candles together tell a story of a fall that exhausts itself and a rise that begins.
The second candle is the key. It is the pause. If the second candle is not small, the pattern is not a morning star. If the third candle does not close into the first body, the pattern is not confirmed. The written rule checks all of these.
Why it takes three sessions to complete
A morning star takes three sessions because it needs three candles. The first candle is the fall. The second candle is the pause. The third candle is the reversal. You cannot know the pattern is a morning star until the third candle closes. Before that, it is just a down candle and a small candle. The pattern is not complete until the third candle's close is known. The mistake beginners make is to see the first two candles and call it a morning star, then buy before the third candle closes. But the third candle may fail to close into the first body, and the pattern is not confirmed.
The written rule on this site does not mark a morning star until the third candle closes. The rule is applied to the stored history after the close.
The mistake of calling it before the third candle closes
The most common mistake with the morning star is to call it before the third candle closes. A trader sees a long down candle and a small candle, assumes a morning star is forming, and buys. Then the third candle fails to rally, and the fall continues. The pattern is not a morning star until the third candle closes well into the first body. The third candle is the confirmation. Without it, the pattern is incomplete.
The written rule on this site waits for the third candle's close. It does not provide a real-time signal. The honest limit is on every page: a pattern describes what has already happened, not what is happening now. The reader must wait for the close to see the pattern.
Why this page has no chart
Every other model page of this site opens with a real stretch of price history. This one cannot. Rule MS-1 was run over every daily candle of the two instruments this site keeps, the S&P BSE Sensex (2,464 bars) and Nifty Bank (2,467 bars), from 7 November 2016 to 5 November 2026. It found no morning star on the Sensex and none on Nifty Bank. The rule was not loosened to produce one, and no stretch is drawn by hand.
That absence is informative in one way. The conditions stack in three sessions: a fall of at least 2 ATR before the first candle, a first body of at least 1 ATR, a small middle candle at or below the first close, and a third body of at least 1 ATR that closes beyond the middle of the first. A shape this specific may simply not occur on two index series in a decade, and this site cannot say whether the cause is the strictness of the rule or the behaviour of these two indices. What the page can say is what it measured: zero. Other instruments, a longer history or a looser rule could give another answer, and none of that is claimed here.
The honest limit
A morning star describes what price has already done in three sessions. It does not predict what price will do next. The pattern is a description, not a verdict. The next candle after the morning star is the confirmation, and even that is not a guarantee. A pattern can form and fail. The market can do anything. This site does not say that the pattern works, and it does not rank patterns. It teaches the definition and the mistake. A reader who finishes this page should know what a morning star is, what each candle says, and why the third candle is the key.
The honest limit is on every page of this site. A candle pattern is a small piece of a larger picture. It is not a strategy. A strategy requires an entry, an exit, and a position size. None of those are decided by a candle. The reader must decide what to do, and that decision is made on a trading platform, not on this page.
The third candle often opens weak and then changes direction
On a daily chart, the long up candle that completes a morning star does not always open strongly. Many readers expect it to gap up from the middle candle, but the real third candle may open flat or even slightly lower before buyers step in. This intra-session recovery is easy to miss if you are watching only the closing price. The body of the third candle can be long even when the open is weak, because the session's range is what matters.
A weak open followed by a strong close is actually a healthier sign for the pattern than a big gap up. It shows that buyers absorbed early selling and then took control, rather than relying on a one-time shock. The third candle's close relative to the first candle's body is the key check, not the open. A close that reaches at least halfway into the first long down candle is the minimum the textbook wants for the reversal to be taken seriously.
If the third candle opens high and then fades to close only slightly up, the pattern has not completed properly. The long body must be built during the session, not inherited from an overnight gap. This distinction saves a reader from calling a morning star when the third candle is a hollow shell.
What the morning star rule cannot see: volume and gaps in time
The stored history holds open, high, low and close and no volume, so rule MS-1 does not use it, and the page cannot say whether a third candle came on heavy or thin trade. The rule compares body sizes in ATR and the position of the third close against the middle of the first body, and that is all.
It also reads only daily candles. A reader who sees the same three-candle shape on an hourly chart is looking at a different thing from what this page defines.
The small middle candle can be a doji, a small body, or a spinning top
The middle candle of a morning star does not have to be a doji. Many beginners believe a doji is required, but the definition allows any small candle that shows indecision. A small black candle, a small white candle, or a spinning top with long shadows all fit. The key is that the middle candle's body is short compared with the first candle's body, and its range is contained within the first candle's range.
A doji in the middle is often the cleanest signal because it shows a complete balance between buyers and sellers. But a small candle that closes slightly lower than its open still does the job: the fall has slowed, and the market is no longer making long down candles. The middle candle's small size is the point, not its colour. A reader who rejects a valid morning star because the middle candle is not a doji is making the pattern harder than it is.
The middle candle also needs to be small in relation to the first candle, not small on an absolute basis. The comparison is always between the three candles themselves.
A morning star that appears after a long, unbroken fall is the one worth waiting for
The pattern's location in the trend is what makes it a morning star rather than a random three-candle sequence. The first long down candle must come after an established fall, not after a single red session. The longer the preceding decline, the more meaningful the third candle's recovery becomes. A morning star that appears after a sideways week is not a reversal; it is just noise.
Readers often spot the three-candle shape anywhere and call it a morning star. The textbook requires a clear downtrend before the first candle. Without that, the pattern has nothing to reverse. The first long down candle should be part of a series of lower closes, not an isolated drop. When the fall before the morning star has been long and steep, the pattern often marks a temporary low. But even then, it does not guarantee a sustained rise. It says that for three sessions, selling pressure weakened and buyers returned. The honest limit applies: a morning star describes what happened in those three sessions, not what the fourth session will bring.
Morning star in brief
Read next
Questions from the classroom
What is a morning star?
It is a three-candle pattern: a long down candle, a small candle that stands apart, and a long up candle that closes well into the first candle's body. It appears after a fall.
Why does it take three sessions?
Because you need three candles. The first is the fall, the second is the pause, and the third is the reversal. The pattern is not complete until the third candle closes.
Can I call it before the third candle closes?
No. The pattern is not a morning star until the third candle closes into the first body. Calling it early is a mistake, because the third candle may fail to rally.
Why does this page have no chart?
Because the written rule for the morning star found no occurrence in ten years of daily candles on the Sensex and Nifty Bank, the two instruments this site keeps. The page says so instead of drawing something that does not meet the rule.
Does the pattern predict the next candle?
No. The pattern describes what happened in three sessions. It does not predict what will happen next. The market can go either way. The pattern is a description, not a verdict.
A trading account is where a chart becomes an order
The patterns on these pages are drawn on real price history, but no chart places a trade. An order needs a size, a stop, and a platform. This site links to one broker's account page; you open the account with the broker, not with this site.