
A plain guide to the six patterns that matter.
Each page takes one pattern, gives its exact definition, and then spends half its length on where readers go wrong. Real candles from this site's own price history carry the examples. The honest limit is on every page: a candle pattern describes what happened in a few sessions and does not predict the next one.
Each pattern has an exact definition you can check against any chart.
Most losses come from ignoring the trend before the candle or trading it alone.
Every example is drawn from this site's own stored price history, not invented.
Six candle models, each found on real price history
Each card is the stretch of real daily candles on which a written rule found the model, drawn from the history this site keeps for S&P BSE Sensex, Nifty Bank. Open a card for the full chart and the rule.
- Hammer and hanging manNifty Bank · 23 Jul – 19 Sep 2025
- Shooting starS&P BSE Sensex · 17 Mar – 19 May 2023
- Bullish engulfingS&P BSE Sensex · 18 Aug – 16 Oct 2025
- Bearish engulfingS&P BSE Sensex · 5 Jul – 5 Sep 2022
- Doji familyNifty Bank · 6 Aug – 5 Oct 2021
Each pattern, taught by its mistake
- Hammer and hanging manOne shape, two names, and why the trend before the candle decides which it is.
- Shooting starA long upper shadow after a rise, and how to tell it from an inverted hammer.
- Bullish engulfingTwo candles, bodies compared, and why a sideways market is the wrong place to look.
- Bearish engulfingA down candle that covers the previous up candle, but only after a rise does it count.
- Doji familyOpen and close at almost the same level: indecision, not reversal, and never traded alone.
- Morning starThree candles that take three sessions to complete, and the mistake of calling it early.
How a page of this school is laid out
Every model page opens with the evidence and only then explains it. Directly under the heading sits a chart drawn from real daily candles: a hollow candle closed above its open, a filled one closed below it, the pale band is the figure, and the labelled circle is the candle the rule matched. Under the chart a caption names the instrument, the source and the date the history was read.
After the chart comes the exact definition in numbers, then the look-alike that readers confuse it with, then the mistake. The mistake is the point of the school: most of what goes wrong with a candle model goes wrong before any trade, when a reader calls a shape by its look and not by its conditions. The last blocks of each page say what the model cannot tell you, and the questions at the end answer the doubts that come up most. Nothing on a page is a signal. A page can end with a finding, and one page ends with the finding that there was nothing to draw.
Seven models, seven written rules
The school covers seven models, and each has a rule written before the search and applied unchanged to both indices. The hammer (HM-1) is a candle of at least 1 ATR whose body takes 5 to 35 percent of the range, with a lower shadow of at least twice the body. The hanging man (HG-1) is the same candle after a rise. The shooting star (SS-1) turns the shape upside down: an upper shadow of at least twice the body after a rise.
The two engulfing pairs (EN-1 and EN-2) compare bodies only: a first body of at least 0.3 ATR and a second of at least 1 ATR that covers it. The doji (DJ-1) is a candle whose body is at most 10 percent of its range, named by its shadows. The morning star (MS-1) needs three candles in a precise order. Each page quotes its rule in full and in plain words. A reader can take any of them to a daily chart of the Sensex and test the candle by hand, which is the intention.
Two indices, ten years, and what the counts say
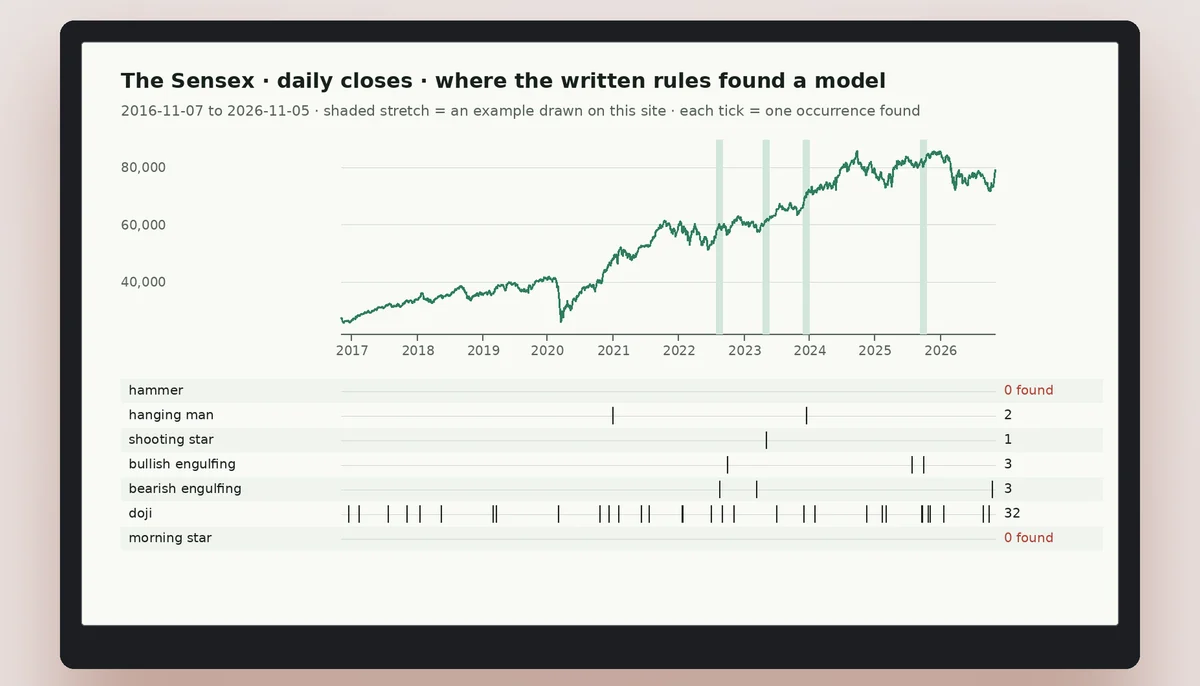
The history behind the site is two indices, the S&P BSE Sensex and Nifty Bank, from 7 November 2016 to 5 November 2026. Over those ten years the rules found one hammer, three hanging men, one shooting star, four bullish engulfing pairs, four bearish engulfing pairs, 72 dojis and no morning star.
The counts teach something before any explanation does. A strict definition makes most named models rare: eight engulfing pairs and five single reversal candles in a decade is a short list, while the doji, which asks only for a tiny body, appears 72 times. A shape that occurs every few weeks cannot be an unusual event, and a reader who treats each one as a message is reading noise into the chart. The counts are not a ranking of the models and they are not a forecast. They describe what these rules found on these two series, and they would change with other instruments or other thresholds.
Why the trend before the candle is measured in ATR
A candle's name depends on what came before it, and the school refuses to leave that to the eye. ATR is the average true range of the last 14 sessions, the typical size of a day's movement at that moment. Writing every threshold in ATR means that a fall of 3 ATR is a large fall in a calm year and also a large fall in a stormy one.
For the hammer, the hanging man and the shooting star the test looks back 10 sessions: the close before the candle must stand at least 3 ATR away from the best close of those sessions in the direction of the trend. For the engulfing pairs and the morning star the test is shorter, 2 ATR over 5 sessions. The doji asks for no trend. These are choices, made once and published, and they are applied identically to every candle on both indices. A reader may think they are too strict or too loose; what matters is that they are stated, so the disagreement can be about a number.
Why a candle counts only when it closes
A candle that is still trading is not yet a candle. A session that touches a low and then climbs can look like a hammer at midday and like nothing at the close, because the close decides where the body sits and how long the shadow is. For that reason every rule here counts a model as formed at the close of its last candle: the hammer at the close of that session, an engulfing pair at the close of the second candle, the morning star at the close of the third.
This is also the mistake the morning star page warns against: buying after two candles because the third is expected. The school does not tell anyone what to do with a formed model. It only insists that the model be complete before it is named, because a name given too early describes a hope. The charts mark the session on which the rule was satisfied, and nothing drawn after that session is used to decide anything.
What a page with no chart tells you
The morning star page has no chart. Rule MS-1 was run over every candle of the Sensex (2,464 bars) and Nifty Bank (2,467 bars) and found no occurrence in ten years. The school could have loosened the rule until a morning star appeared, or borrowed an example from another market, and either would have put a chart on the page. Neither would have been honest.
The result is an observation about these rules on these two series, and the page says exactly that. It does not claim that morning stars never happen, and it does not claim they are meaningless; it claims that this definition, written in advance, produced zero. Readers who remember a morning star from a textbook have remembered an illustration. The difference between an illustration and a rule applied to real history is the reason the school exists, and a blank where a chart would be is part of the lesson.
Bars without a range, and why they are removed
The price source sometimes prints a bar whose high equals its low: an exchange holiday, or a day with no trading, filled with a single price. Such a bar carries no session. Left in the history, it would pass for an inside bar or sit as a perfectly flat neighbour beside a real candle, and it would distort the average true range that every threshold uses.
Before any rule runs, bars with no range are removed from the stored history. On the Sensex that removed nothing; on Nifty Bank it removed one bar. The cleaning is the same for every rule and happens before any count, so it cannot favour a result. It is mentioned here because a reader who compares a chart with a platform's chart may find that a date is missing, and the answer is that nothing traded on it. The history that remains is 2,464 bars for the Sensex and 2,467 for Nifty Bank.
What a drawn candle leaves out
A chart on this site shows one occurrence, chosen as the cleanest by the rule's own measure when there are several. It leaves out what happened next in any way that could be counted, it leaves out volume because the stored history holds only open, high, low and close, and it leaves out every time frame except the daily one.
It also leaves out the instruments that are not here. The two indices are not the whole Indian market, and a model that appears often on one may be absent on another. These omissions are not hidden; each is stated where it applies. A reader who wants a measure of how often a pattern was followed by a move would need a counting definition and a larger set of instruments, which is a different site's job. This one teaches the shape, the rule and the mistake, and stops there.
Where the broker page fits
The site links to one broker, FxPro, from the button in the header and from the call to action at the foot of each page. The link is an advertising relationship: if a reader opens an account through it, the site is paid. The broker page explains in plain words what the account is, what a contract for difference is and is not, and what to read in the terms from India before any money is sent.
None of the candle pages needs the account. Every chart and every rule is on the pages themselves, and a reader who only wants to learn to name a candle correctly can stop reading at the last question. The order ticket on a trading platform asks for a size, a stop and a take profit, and those are the decisions that a candle model cannot make for anyone.
A trading account is where a chart becomes an order
The patterns on these pages are drawn on real price history, but no chart places a trade. An order needs a size, a stop, and a platform. This site links to one broker's account page; you open the account with the broker, not with this site.